R Programming and Statistics for Data Science
This document provides an overview of basic statistical tools for data science
Andrew L. Mackey
Overview
Statistics and probability are important tools for the analysis of data.
Basic Statistics
Sample Mean
$$ \bar{x} = \dfrac{1}{n} \sum\limits_{i=1} x_i$$data <- c(1,2,3,4,5) mean(data) sum(data)/length(data)
Sample Variance
$$ s^2 = \dfrac{1}{n-1} \sum\limits_{i=1} (x_i - \bar{x}^2) $$var(data) sum( (data - mean(data))^2 ) / (length(data) - 1)
Sample Standard Deviation
$$ s = \sqrt{s^2}$$sd(data) sqrt( var(data) )
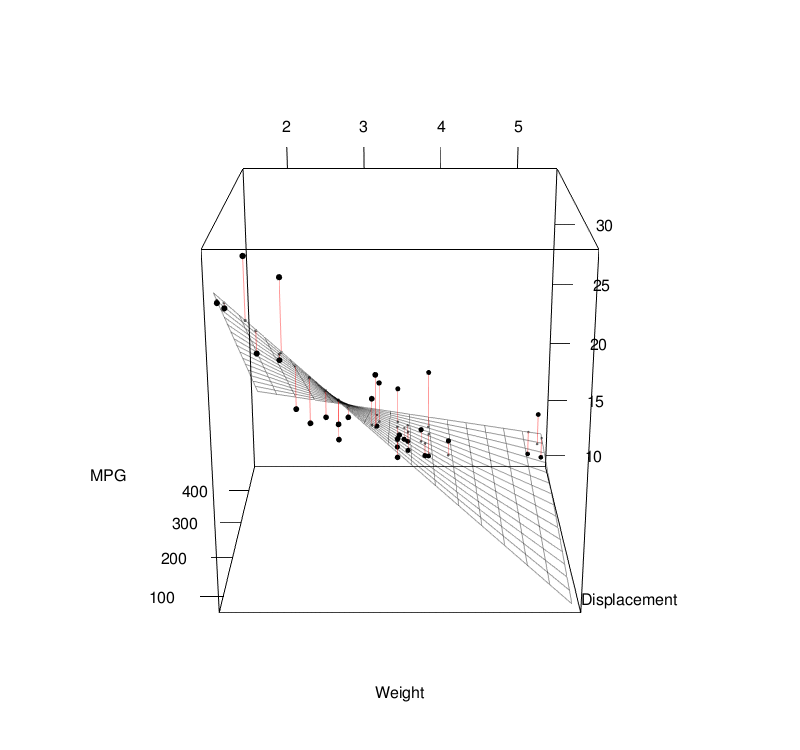
Linear Regression
Linear regression models assume some relationship exists between a response variable ( \(y\) ) and its predictor (or independent) variables ( \(\mathbf{x} \) ). $$ \begin{align} y &= \mathbf{x} \beta + \epsilon \\[1em] &= \beta_0 + \beta_1 x_1 + \beta_2 x_2 + ... + \beta_p x_p + \epsilon \\[1em] \end{align} $$To estimate the coefficients, we can use the least-squares approach:
$$ \begin{align} \hat{\beta} &= (\mathbf{x}^T \mathbf{x})^{-1} \, \mathbf{x}^T \mathbf{y} \\[1em] &= \beta_0 + \beta_1 x_1 + \beta_2 x_2 + ... + \beta_p x_p + \epsilon \\[1em] \end{align} $$We can use the following code in R to estimate the coefficients manually.
betahat <- solve( t(x) %*% x ) %*% t(x) %*% y
Linear Regression Model Predictions
Once we obtain the \( \beta \) weights for our model (either by deriving them or through Gradient Descent), we can have the model estimate/predict values for given input data:
$$\hat{y} = \mathbf{x} \beta$$ $$h_\mathbf{\beta}(\mathbf{x}) = \hat{y} = \mathbf{x}\beta$$The hypothesis function \( h_\beta(\mathbf{x}) \) (outputs are often denoted as \(\hat{y} \)) accepts some record \(\mathbf{x} = \begin{bmatrix} 1& x_1 & x_2 & ... & x_p \end{bmatrix}\) and multiplies it by the corresponding weights \( \beta = \begin{bmatrix} \beta_0 \\ \beta_1 \\ \beta_2 \\ \vdots \\ \beta_p \end{bmatrix}\).
#****************************************************
#* Define a function named "predict" that serves as
#* the hypothesis function.
#*
#* @param    w      a vector of weights
#* @param    x      a vector of inputs
#****************************************************

predict <-  function(w,x) {
  result <- x %*% w    # matrix multiplication
  return(result)
}

# Example weights (betas)
w <- c(100, 0.5, 2.0)

# Example input vector
x <- c(1, 30, 2)


# Element-wise multiplication
yhat <- sum(w*x)
print(yhat)

# Matrix multiplication
yhat <- predict(w,x)
print(yhat)
Suppose that we had a dataset with two features, \(\mathbf{x}_1\) and \(\mathbf{x}_2\). We will define the following sample data comprised of two features and four records, giving us the resulting dimensions of \( 4 \times 2\):
$$\mathbf{X} = \begin{bmatrix} 10 & 20 \\ 30 & 40 \\ 50 & 60 \\ 70 & 80 \end{bmatrix}$$mydata <- c(10, 20, 30, 40, 50, 60, 70, 80) X <- matrix(data=mydata, nrow = 4, ncol = 2, byrow=TRUE)
Next, we need to add the bias column for our matrix:
$$\mathbf{X} = \begin{bmatrix} 1 & 10 & 20 \\ 1 & 30 & 40 \\ 1 & 50 & 60 \\ 1 & 70 & 80 \end{bmatrix}$$biasweight <- 1 bias <- replicate(n=4, expr=biasweight) X <- cbind(bias, X)
We can now predict all \(n\) records in \(\mathbf{X}\) using matrix multiplication as \(\mathbf{X} \times \mathbf{w}\):
yhats <- predict(w,X)